Have you ever wondered how much time you spend in meetings, reading or writing emails, or performing any number of other daily tasks? I know I do. I often wish I could work smarter on all the tasks that I have every day. However, no matter how much we try to work smarter and to be more efficient, we can’t always be at the top of our game.
Luckily, in Office 365 we can see relevant information by using the feature called “MyAnalytics,” previously known as Delve Analytics. This feature helps focus on what matters most by providing personalized insights about how you spend your time at work. It gives you insights on two of the most important factors in personal productivity: how you spend your workdays and whom you meet with.
Details about how much time you spend in meetings, answering emails and focusing on your work let you know exactly where your time is going. “Top collaborators” and “Losing touch” features provide information about how you collaborate, including read rates, response times, and overall collaboration time. The personal dashboard gives you a comprehensive view of your time and collaboration. Each component of MyAnalytics is designed to benefit you and what you do each day.
How MyAnalytics can be used to manage time
With MyAnalytics you can quickly see what you are doing. By simply looking at “Your time this week,” you can see where you spent your time and know where you need to make changes.

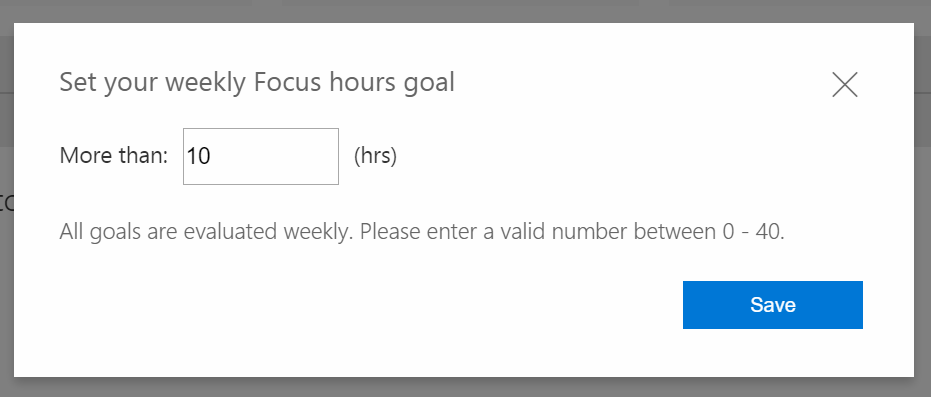
The dashboard shows you how you work. You can set goals each week and monitor your work hours. This can be beneficial for you as well as for those you work with.
How to enable MyAnalytics in 4 Steps
1) Setup
You need to understand the licensing. This application is available within the following plans free of charge:
- Office 365 Enterprise E5 Plan
- Office 365 Education E5 Plan
- Office 365 Nonprofit E5 Plan
You can also purchase it as an add-on for the following plans:
- Office 365 Enterprise E1 to E3 plans
- Office 365 Education E1 to E3 plans
Once you have purchased the licenses, you need to assign them to the users that require this functionality.

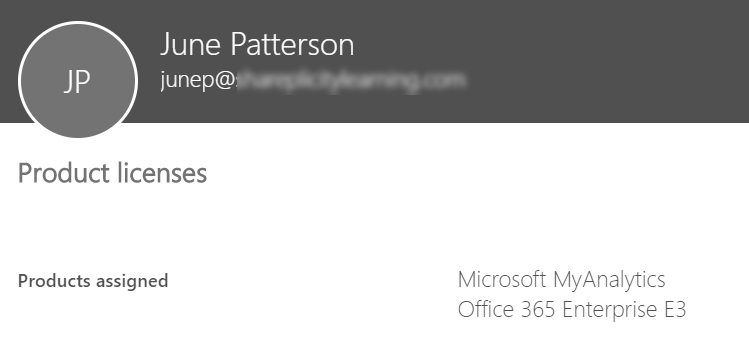
Once the license is applied, the features will become available to your users. To have full capabilities of MyAnalytics, your users need to have SharePoint licenses.
Next you will need to review the privacy guide to understand how privacy is controlled and maintained. This can be reviewed here.
2) Configuration
Once you or your IT administrator has assigned licenses to your users, IT will determine how these features will be made available. Office 365 currently offers three options: Opt-In, Opt-out and Excluded. In some circumstances, you may not want to provide these features to all users, or you may be performing a test involving only a subset of users. The default option is Enabled for all licensed users; to change this you will need to use the “Opt-out” flag, and the easiest way of doing this is with PowerShell:
Set-UserAnalyticsConfig -Identity {User} -PrivacyMode {Mode}
In order for this to work, users will need the ability to access the Office Graph. The default setting within Office 365 enables this functionality, but if you see any issues, you will need to check this setting.
Access the SharePoint Admin Center, then click Settings and select the option Allow access to the Office Graph.

3) Personal dashboard
The personal dashboard will help you understand how you communicate and spend your time at work. Setting weekly goals for different areas, such as time spent in meetings and focus time, will help you measure your progress towards these goals. You’ll get tips that can help you prioritize your work and spend your time more effectively.
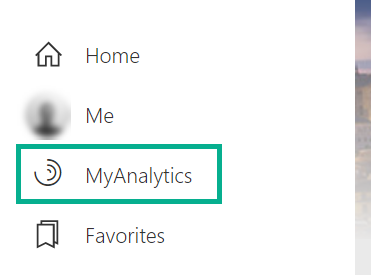
To access the dashboard, navigate to your personal “my site” and click the navigation item on the left.
The personal dashboard uses information from your Office 365 mailbox and calendar, such as emails and meeting information. No personal data such as email bodies or calendar descriptions are used or needed. However, some of your data is used to calculate aggregate statistics, which are shown to other MyAnalytics users. Examples include calculating the average amount of time that people in your organization spend reading and writing emails, or how much time they spend in meetings.
By default, the dashboard displays eight core blocks of data. The following table outlines the types of data and provides information about where it comes from and how it is used.
|
Name |
What you see | Data Source | Calculation Details |
|
Your Time |
Overview of how you spent your week, compared to goals you have set | Office 365 Mailbox and Calendar | Calculated using Meetings, Email, Focus Hours and After Hours values |
|
Stay in touch |
Top collaborators who spent most of their time with you. | Office 365 Mailbox and Calendar |
Calculated using Email and Meeting values |
| Losing touch | Colleagues whom you have not had contact with during the week | Office 365 Mailbox and Calendar |
Calculated by looking at previous contacts and checking if contact was made during the week |
|
You and your manager |
How much time you spent with your manager in meetings or email | Office 365 Mailbox and Calendar | Calculated from read rates and response times between you and your manager |
| Meeting hours | Breakdown of time spent in meetings, time between meetings and between meetings personally scheduled versus those scheduled by others | Office 365 Mailbox and Calendar |
Calculated based on meetings with status set to Busy. |
|
Meeting habits |
How much time you spent in common category meetings such as: Multitasking in meetings, After hour meetings, Recurring meetings, Longer meetings and Conflicting meetings | Office 365 Mailbox and Calendar | Calculated based on meetings with status set to Busy. Meetings are categorized by type. |
| Email hours | How much time was spent sending and reading email | Office 365 Mailbox |
Calculated for writing or reading emails. Predefined time blocks based upon time calculations. |
|
Email activity |
Displays how many emails you sent or read during business hours | Office 365 Mailbox | Same as Email Hours |
| Email habits | Displays the percentage read by others and read by you | Office 365 Mailbox |
Calculated using read rates and response times; estimates based on an average over 30 days |
|
Focus hours |
Displays main focus hour time | Office 365 Calendar | Calculates the total number of hours in your calendar, as well as email sent or read in gap time |
| After hours | Shows the time spent on email and meetings outside of normal defined hours | Office 365 Mailbox and Calendar |
Same as Focus Hours, Meetings and Email |
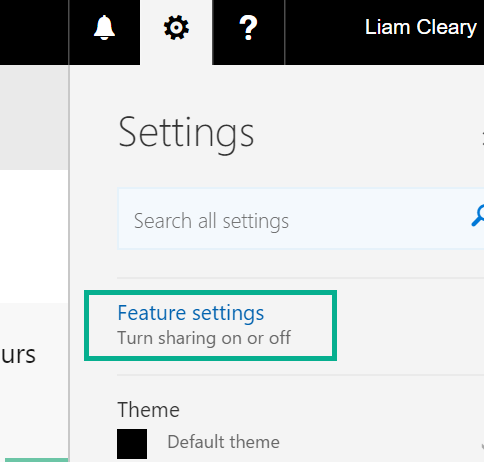
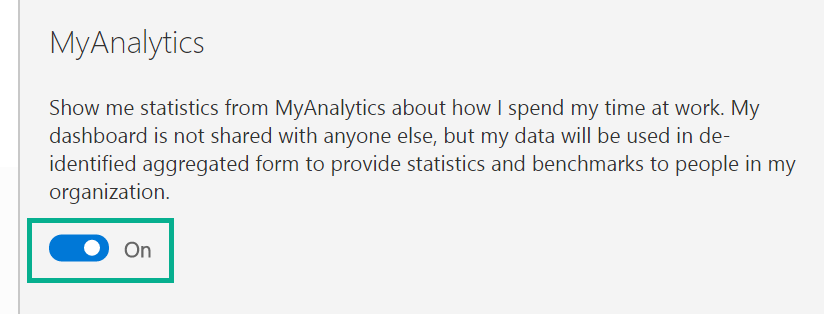
If at any point you want to opt-out of this content and feature, click Settings and then Feature Settings. Then set the value to Off.
4) Outlook add-in
There is an add-in for Outlook that can be easily installed and facilitates the capturing of emails used within the reports and statistics. This application is installed automatically when you assign either an E5 license or the add-on license. Sometimes it is not available, but you can manually install it; just use the following URL:
https://agave.o365weve.com/manifest/Delve%20Analytics%20Official%20.xml
Save the XML file, as you will need to open this within your Office 365 Email settings page. Navigate to your email within your browser of choice, then log into the Office 365 tenant either direct to your email or use the following URL:
https://outlook.office365.com/owa/?path=/options/manageapps
Choose to manually add an application from the file that you saved previously. It will prompt for permissions, and install based on your IT administration permissions.
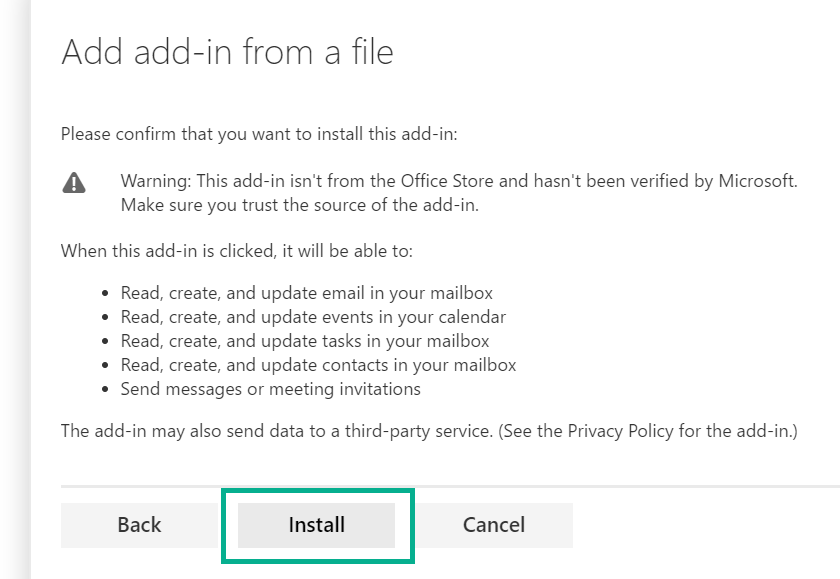
As you can see, it is very simple to get the application installed, which will then facilitate the capturing of the data for the reports that you see within the MyAnalytics dashboard.
Then you’re ready to use MyAnalytics and start working smarter. Knowing where your time goes and how to optimize your work will now be an easy task.

